Foresee Price Changes With Live Agriculture Supply and Demand
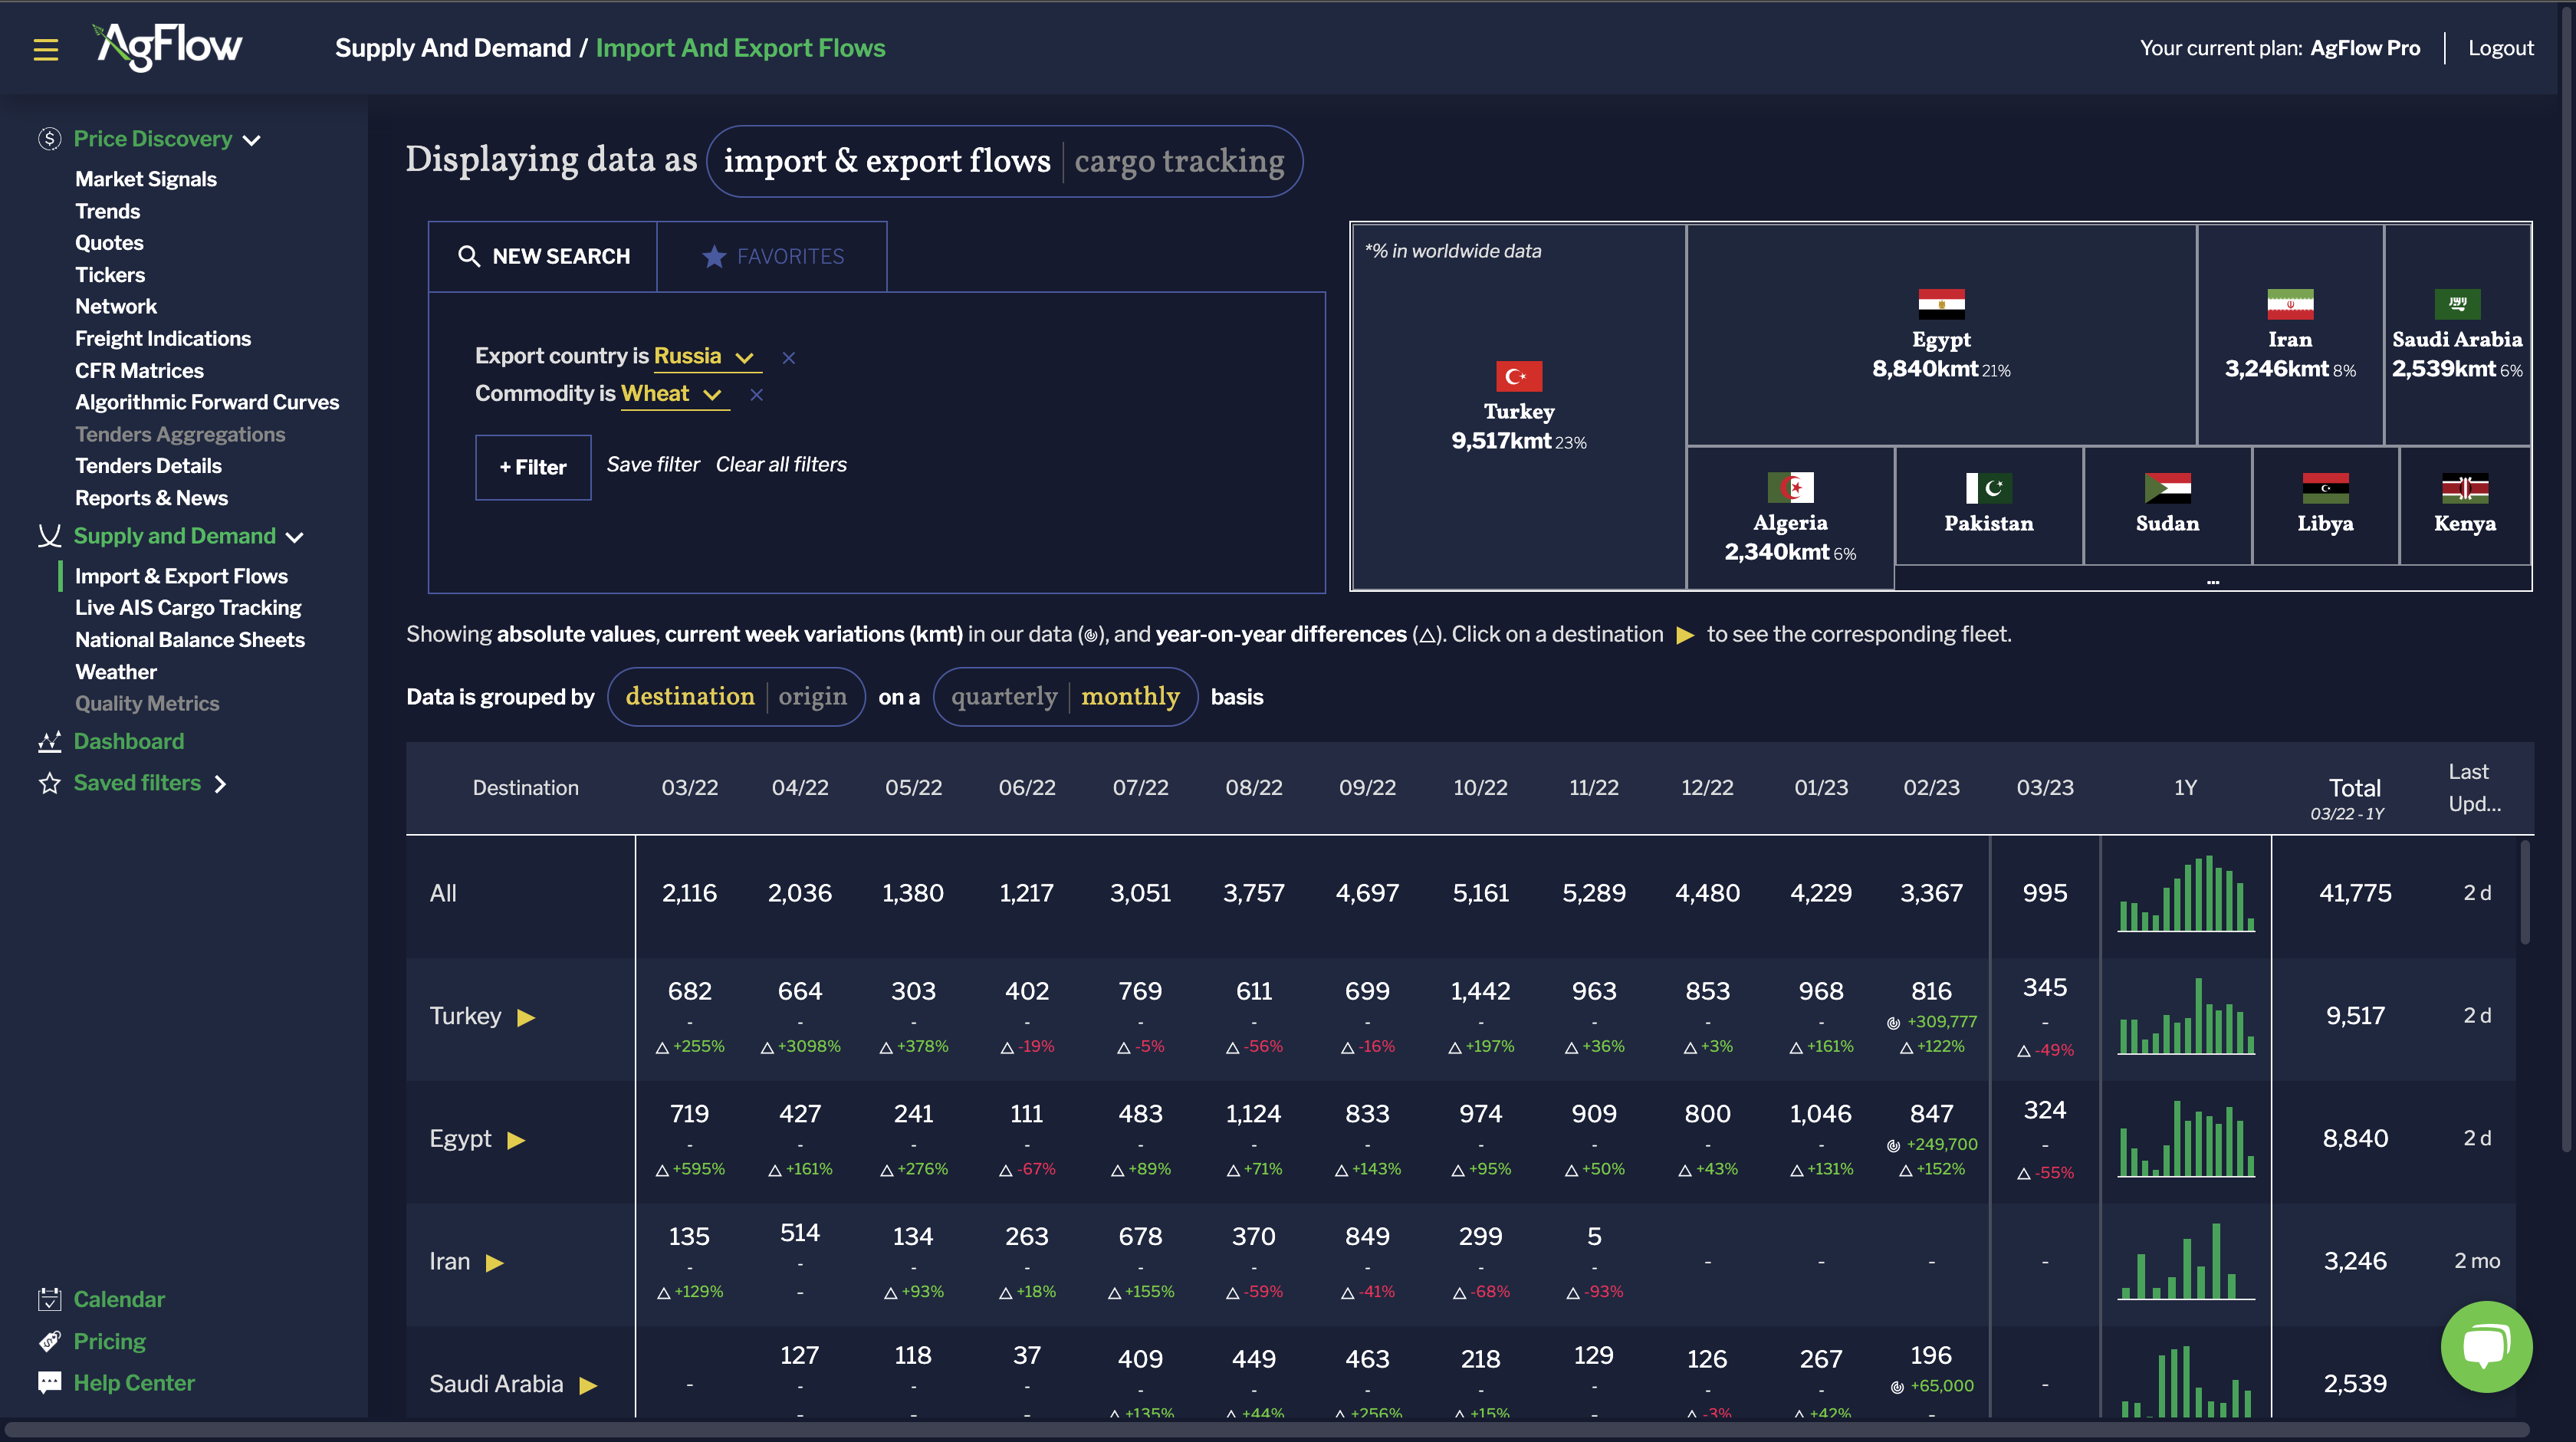
Stay ahead of the curve with AgFlow’s unrivaled agriculture supply and demand tracking tool. Monitor Grains, Oilseeds, and Vegoils markets across 800+ ports on 2,000 vessels and anticipate price changes. Track more than 755 million metric tons of cargo annually up to seven months before customs clearance. Compare today’s figures with last year’s to know where the market is headed.
Trusted by Thousands of Agricultural Commodities Professionals
4 Reasons to Get Agriculture
Supply & Demand Data From AgFlow
Anticipate World Ag Supply & Demand
Track 755+ Mmt transported by sea yearly up to seven months before customs.
Get a Clear Picture of Where the Market Is Headed
Compare today's figures with last year's data.
Anticipate Price Changes
Monitor Grains, Oilseeds, & Vegoils markets across 800+ ports.
Download the Aggregated Volumes as Charts & Spreadsheets
AgFlow's Agriculture Supply & Demand in Numbers
Tons of Cargo Tracked Yearly
Ports Covered
Vessels Tracked Monthly
Who Benefits From AgFlow’s
Agriculture Supply and Demand Tool?
Follow the global demand variations over the last years and view the demand for the next two months thanks to the most accurate and timely trade flows data available on the market to:

Market Research

Sourcing

Risk Management
Risk Management

Trading
Unlock All Vessel Details
- Track cargoes of 2,000 monthly vessels in real-time thanks to AIS data
- Unlock all vessel details, incl. vessel name, volume, export & import port

Refine Your Search
- View all flows by destination or origin and by month or quarter
- Filter flows by commodity, import or export country, and date

Track World Production & Consumption
View how national production and consumption variables have evolved since 2013. Get weekly or monthly updates on supply and demand data derived from the national balance sheets of 9 agricultural agencies:
-
- ABARES
- CGC
- CONAB
- Comex Stat
- European Commission
- Gafta
- International Grains Council
- Ministerio de Agricultura, Ganaderia y Pesca
- USDA

How We Collect Agriculture Supply & Demand Data
Every day, our world-renowned network of port agents, inspection companies & shipping firms sends us the lineups of virtually all vessels transporting Grains, Oilseeds or Vegoils. We then clean the data received to eliminate duplicates and errors and standardize it into one format to display the global supply and demand of Grains, Oilseeds, and Vegoils on AgFlow.
What Our Clients Have to Say
"I strongly recommend AgFlow to other traders or brokers dealing locally and willing to expand beyond their region, as such market data and information are not easy to get for smaller players."


