China Corn: Land Rent Costs Up 24%, the Spot Profit Fluctuates Highly
Talk to our team about AgFlow's offering →
Reading time: 2 minutes
China is a significant Corn producer and a major Corn consumer and trader, ranking at the forefront of the international Corn industry. Among them, the Corn harvest area ranks first in the world all year round; Corn production ranks second in the world after the United States; the total Corn consumption ranks second in the world, accounting for more than a quarter of the world; Corn feed consumption ranks first in the world, accounting for nearly 1/3 of the world; Corn imports account for more than 10% of the world, while exports are less than 1% of the world.
From a domestic perspective, China’s Corn planting area has been stable at more than 600 million acres all year round and has remained at more than 650 million acres for two consecutive years from 2021 to 2022. Output has fluctuated around 250 – 270 million tons all year round.
A total of 30 provinces except Hainan are involved in large-scale production of Corn. However, the planting distribution of Chinese Corn in various regions is not balanced, mainly concentrated in the Northeast, North, and Southwest regions, roughly forming an oblique Corn planting belt from the Northeast to the Southwest.
The provinces with relatively large production scale mainly include Heilongjiang Province, Jilin Province, Inner Mongolia Autonomous Region, Shandong Province, Henan Province, Hebei Province, and Liaoning Province – the Corn planting area of these seven provinces has remained at 270 million tons all year round.
It covers an area of more than 40 million acres, and the output remains above 20 million tons all year round. “Heilongjiang Province, Jilin Province, Inner Mongolia Autonomous Region, and Liaoning Province” are as famous as the American Corn Belt and the Ukrainian Corn Belt at the same latitude and are known as “the three largest in the world”.
From 2013 to 2022, China’s Corn output per unit area fluctuated from 401.06 kg/mu to 429.07 kg/mu, an increase of 6.98% in the past nine years, with an average annual compound growth rate of approximately 0.75%.
Heilongjiang – A Corn Leader
In 2022, the Corn planting area in Heilongjiang Province reached 89.55 million acres, accounting for 13.8% of the national planting area, and the total Corn output was 40.4 million tons, accounting for 14.6% of the total national production.
In terms of planting costs, according to CITIC Futures’ survey of the Northeast region, planting costs continued to rise in 2023, with planting costs in Heilongjiang and Jilin reaching 19,000 – 22,000 yuan per hectare (2,602.7 – 3013.7 US dollar/ton), a year-on-year increase of about 16%. The cost increase mainly comes from land rent, and expenses such as seeds and fertilizers have increased to a certain extent.
The average land rent in Heilongjiang reached 12,400 yuan/hectare, a year-on-year increase of 24%. In its main Corn-producing cities, such as Harbin, Suihua, and Qiqihar, the average land rent reached 13,000 – 14,000 yuan/hectare, and high-quality land reached 18,000 – 20,000 yuan/hectare. Based on the cost feedback from survey samples, the port cost of Corn produced in 2023 was predicted to be approximately 2,450 – 2,650 yuan/ton (335.6 – 363.0 US dollars/ton).
Corn Trade and Profits
China implements a tariff quota policy for imported Corn, and additional tariffs will be levied on parts exceeding the quota. In 2023, the country’s Corn import quota was 7.2 million tons. The primary import and export commodities are “Corn, except for seed use,” “frozen sweet Corn,” “Corn starch,” “sweet Corn prepared or preserved by non-vinegar methods,” “Corn fine flour,” and “seed Corn.”
In 2022, the commodity with the most significant import volume and import value was “Corn, except for seed use.” China imported about 20.6 million tons of “Corn, except for seed use,” with an import value of US$7.10 billion. Each accounted for 30% of the total import volume and total import value of Corn-related commodities that year. The quantity and value of imports from the United States are as high as 72.1% and 74.44% respectively.

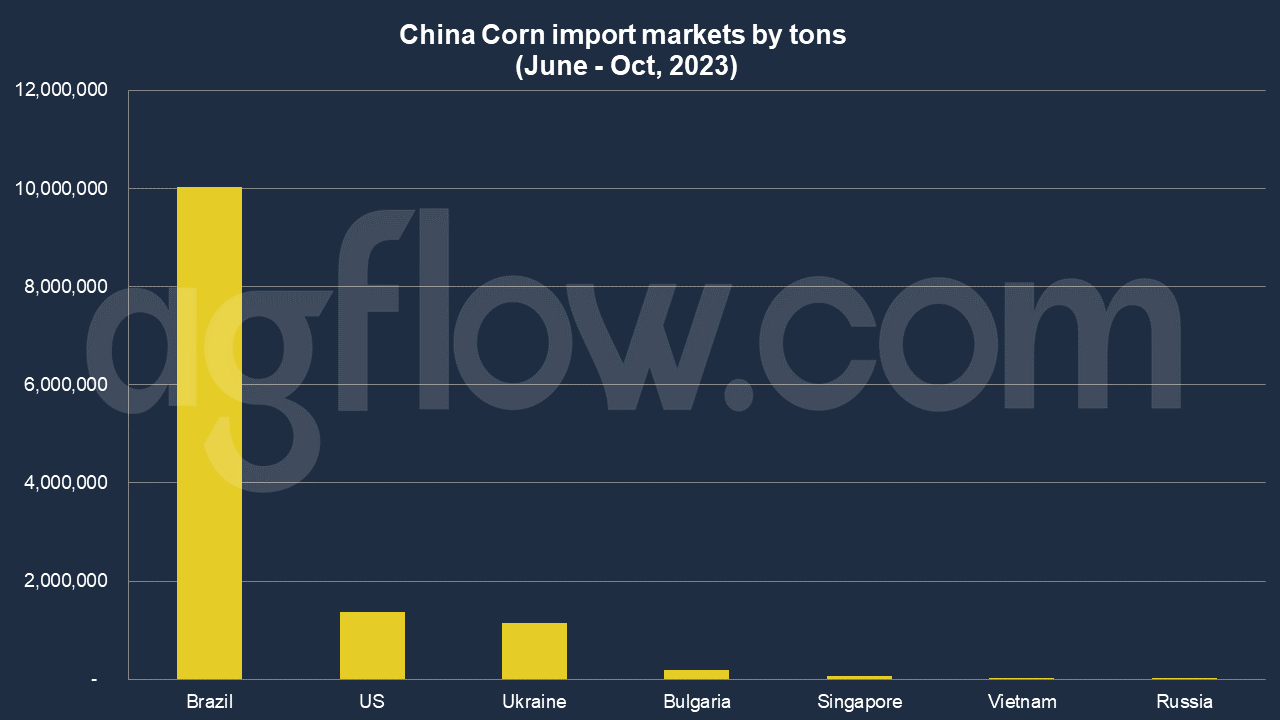
According to AgFlow data, China imported 10 million tons of Corn from Brazil in June – October 2023, followed by the United States (1.3 million tons), Ukraine (1.1 million tons), Bulgaria (0.2 million tons), Singapore (71,092 tons), Vietnam (32,550 tons), and Russia (14,400 tons). Total imports hit 21.8 million tons in Jan – Oct 2023.
As per Chinese customs data, since 2017, China’s total export volume and export value of Corn-related commodities have fluctuated. In 2022, China’s Corn-related commodity export volume was 286,300 tons, a year-on-year increase of 35%; the export value was 168.4 million US dollars, a year-on-year increase of 38%.
The commodity with the most significant export volume and value is “Corn starch”. The scales were 221,800 tons and 113.4 million US dollars, respectively, accounting for 77.46% and 67.35% of the total export volume and export value of Corn-related commodities that year and were mainly exported to Indonesia and the Philippines.

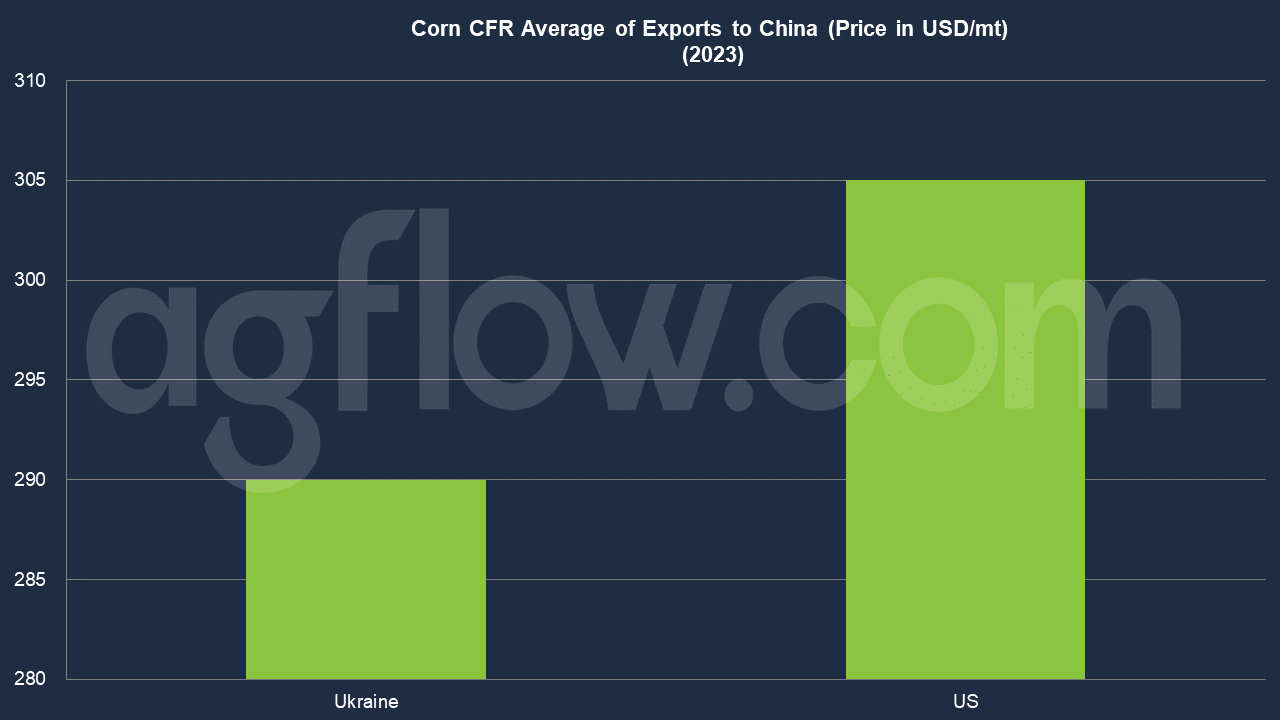
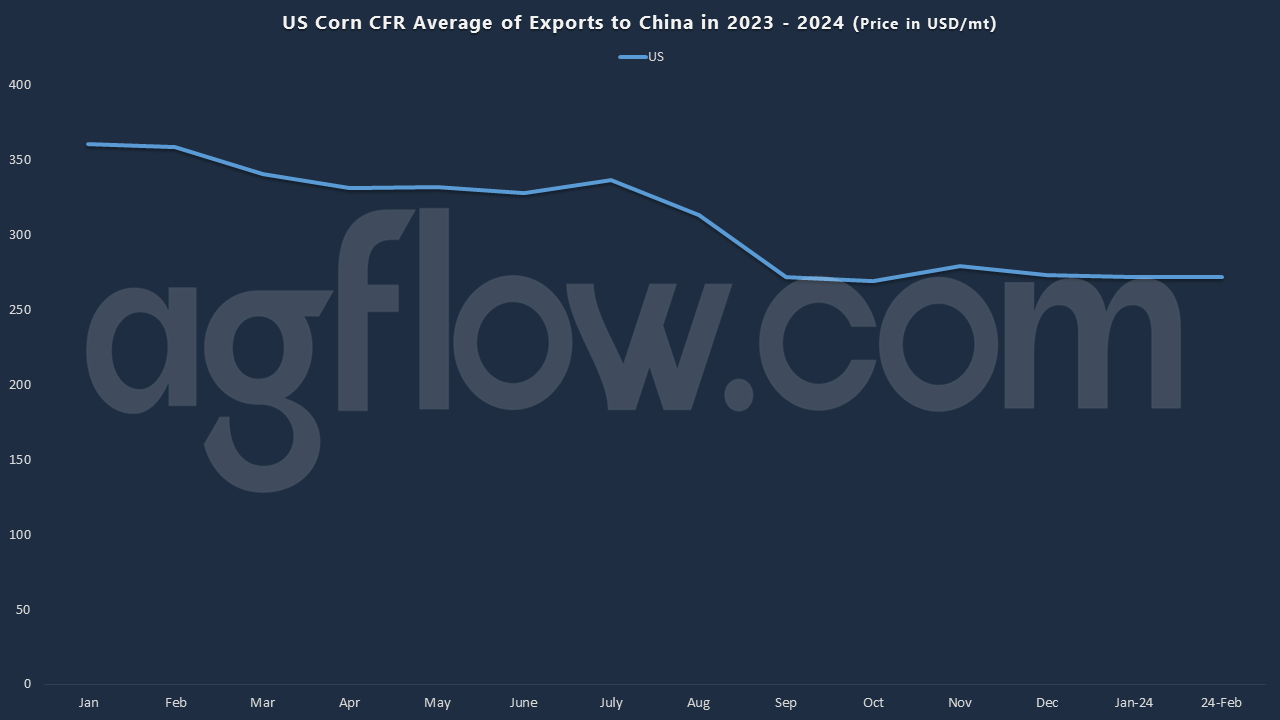
Ukraine quoted China CFR price, USD 290 on average, in Jan – Oct 2023. The United States offered USD 305. In terms of CIF price, Ukraine’s was USD 305 on average. For trend, US Corn CFR average of exports to China declined since January till June. A sharp fall was occurred in September. Since then, it showed a stagnant trend.

In January, the prices at the north and south ports were aligned, and the spot profit was 10-30 yuan/ton. In February, the spot profit turned negative. At the end of April, the inversion increased, and the spot loss was reached 150 yuan/ton. Then, it decreased to 30 yuan/ton at the end of June.
The spot profit calculation formula is: Southern Port sales price – Jinzhou Port closing price on the day – bulk shipping freight (70 yuan/ton) – port miscellaneous charges (30 yuan/ton) – loss and interest (20 yuan/ton).
From a domestic perspective, feed and industrial use are the main downstream applications of Corn. According to statistics, China’s total Corn consumption in 2021 was 288.64 million tons, of which consumption for feed and industry reached 175.1 million tons and 91.5 million tons respectively, accounting for 60.7% and 31.7% of the total consumption that year.
Try AgFlow Free
Access Free On Updates for Corn, Wheat, Soybean,
Barley, and Sunflower Oil.
No Credit Card Required & Unlimited Access In Time

