Will China Remain the First Global Soybean Importer in 2023?
Reading time: 7 minutes
![]() Free Article
Free Article
China Soybean Production Far From Self-Sufficiency While Brazil’s Is Rising
Despite production losses due to La Niña, Brazil remains the world’s largest Soybean producer in MY 2021/2022. The USDA estimates Brazil’s Soybean production will increase by 46 Mmt in MY 2022/2023 YoY. Meanwhile, the U.S., the world’s second-largest Soybean producer, barely reached half of Brazil’s production in MY 2021/2022 (~48%). The U.S. Soybean production increased by 6 Mmt between 2020 & 2022, which was due to a 1.51 Mha increase in land and a 0.03 mt/ha improvement in yields. Ultimately, production should increase by 1.9Mmt YoY in MY2022/2023. In China, Soybean production averages around 16.1 Mmt yearly. On the other hand, domestic consumption averages 106.77 Mmt yearly, and the USDA estimates consumption will rise by 8.87Mmt in MY 2022/2023 YoY to reach 115.59 Mmt. China relies on imports to fulfill 86,6% of its domestic consumption, making the country the largest Soybean importer globally and by far the most attractive market for Brazil and the U.S.
Figure 1: Soybean Production in the U.S., Argentina, and China between 2018 and 2023
Track Soybean production from Brazil, Argentina, and Up to 62 Other Origins
Free & Unlimited Access In Time
Read also: Kazakhstan Aims to Increase Soybean Output
U.S. and Brazil Alternating Their Soybean Exports to China Throughout the Year
China – the world’s largest Soybean importer – sourced 70.86 Mmt of Soybean between Jan and Sep 2022. As Brazil Soybeans harvesting generally occurs in November/December, China gradually increases its imports from Brazil in Q1 & Q2 of the following year. Over the past three years, China’s Soybean imports from Brazil increased to a peak in March, reaching 10 and 11 Mmt in 2020 and 2021, respectively. Meanwhile, the U.S. harvests Soybeans in September, therefore, China increases its imports from the U.S. in Q4. American exports to China peaked at 8 Mmt and 7 Mmt in Oct of 2020 and 2021, respectively. To maintain a regular monthly supply, China leverages seasonality to secure imports at the beginning of the new marketing year for Brazil and the U.S,. In addition, the country sources Soybeans occasionally from Argentina, Canada, and Uruguay.
Figure 2: Brazil and U.S. Monthly Soybean Exports to China Between January 2020 and September 2022
Track Monthly Soybean Exports From Up to 43 Origins since 2017
Free & Unlimited Access In Time
U.S. and LatAm Soybean Exports Dependency on China
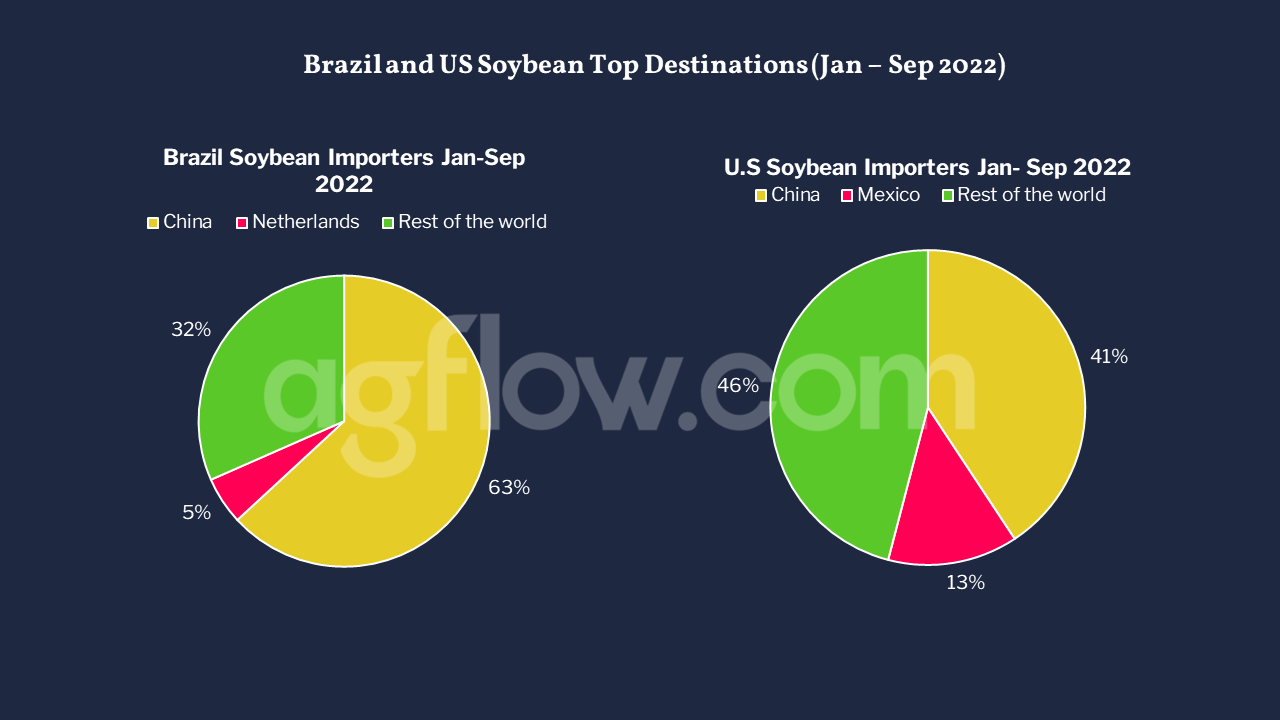
Brazil exported 104 Mmt of Soybean in 2021/2022. Among these exports, 68% headed to China, a 6.7 Mmt YoY increase. Spain, the second destination for the Brazilian Soybean, reached 3.7 Mmt of imports in 2021/2022, 67.09 Mmt less than what China imported from Brazil the same year. China also ranks as the first destination for U.S. Soybean exports. Moreover, despite Soybean exports to China decreasing by 6.8 Mmt in 2021 YoY, exports rose by 2.8 Mmt YoY between Jan and Sep 2022. China is also the top importer of Argentina’s and Uruguay’s Soybeans, reaching 1.7 Mmt and 1.6 Mmt between Jan and Sep 2022, respectively.
Figure 3: Brazil and U.S. Top Soybean Destination Between January and September 2022
Track Brazil, and Argentina Soybean Exports to Up to 79 Destinations Since 2017
Free & Unlimited Access In Time
Read also: Brazil Is Losing the Italian Soybeans Market
China’s Imports From Brazil Remain Stable Despite Prices Rising
China’s Soybean imports have remained stable over the last three years, ranging from 4.2 Mmt to 12.7 Mmt monthly. In 2020, the delta between Brazilian and U.S. CFR price indications remained in favor of the U.S., with peak spreads at USD 57/mt in Jan and USD 50/mt in Dec. In 2021, China’s Soybean imports from the U.S. peaked at 8 Mmt in Oct, with U.S. CFR prices at USD 33/mt cheaper than in Brazil. Yet, in 2022, Brazil will remain the major Soybean supplier for China despite lower U.S. Soybean CFR prices, meaning that Soybean prices are less of a driver of Chinese demand than the seasonal supply.
Figure 4: Monthly U.S. & Brazil Soybean Exports CFR Estimations to China Between January 2020 and September 2022
Access + 1k Daily Soybean CFR indications to Up to 24 Destinations
Free & Unlimited Access In Time
Read also: Indian Soybean Oil Traders Turn to the US
In a Nutshell
With a population of 1.426 bn China has one of the largest global consumer markets, especially when it comes to Soybean used for animal feed and edible oils making China the largest export market for Soybeans worldwide. The country only produces 15% of its Soybean consumption and imports the rest mainly from Brazil and the U.S.
Brazil is the primary supplier of Soybean to China, with exports rising periodically regardless of prices. Soybean imports from Brazil increased by 7 Mmt between 2020 & 2021, while imports from the U.S. decreased by the same amount. Yet, U.S. Soybean exports to China increased in Q1 & Q2 2022 YoY, showing a renewed interest in U.S. Soybean products.
Finally, in addition to the growing consumption, China’s Soybean area harvested decreased by 1.29 Mha over the past five years to 23.38 Mha in 2020/2021. Thus, China’s reliance on Soybean imports is meant to last. With rising tensions with the U.S., China is developing new import pipelines in LatAm and Russia.


