Optimize Freight ExecutionWith Dry Bulk & Wet Cargo Rates
View Grains, Oilseeds, and Vegoils freight markets from a global perspective across 900 routes globally. Complete your trading scenarios with 2,500+ dry bulk and wet cargo freight rate indications daily.
Trusted by Thousands of Agricultural Commodities Professionals
3 Reasons to Source Dry Bulk Freight Rates on AgFlow
Optimize Freight Execution
Find the freight rate indications that work for you among 2,500 daily updates.
View Freight Rate From a Global Perspective
Access 2,500+ daily freight rate updates from 900+ routes globally.
Build Trading Scenarios
Thanks to 6-month historicals and 12-month forward curves charts.
AgFlow in Numbers
Daily Freight Rates
Freight Rates Historical Since 2013
Freight Routes
Who Benefits From AgFlow’s
Dry Bulk & Wet Cargo Freight Rates
View freight markets from a global perspective across 800 ports and with 2,500 daily updates to:

Market Research
Market Research
Access current and historical freight rate indications

Sourcing
Sourcing
Ensure optimal execution of your annual supply purchase

Risk Management
Risk Management
Use freight rates as a benchmark for Mark-to-Market
Use freight rates as a benchmark VaR reconciliation

Trading
Trading
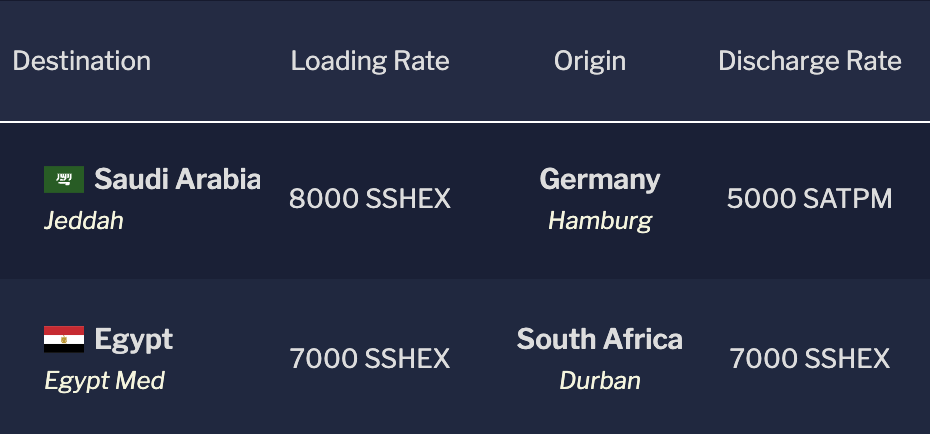
See Loading and Discharge Rate
See the loading and unloading rates for all freight indications to get a better estimate of your costs at the port.
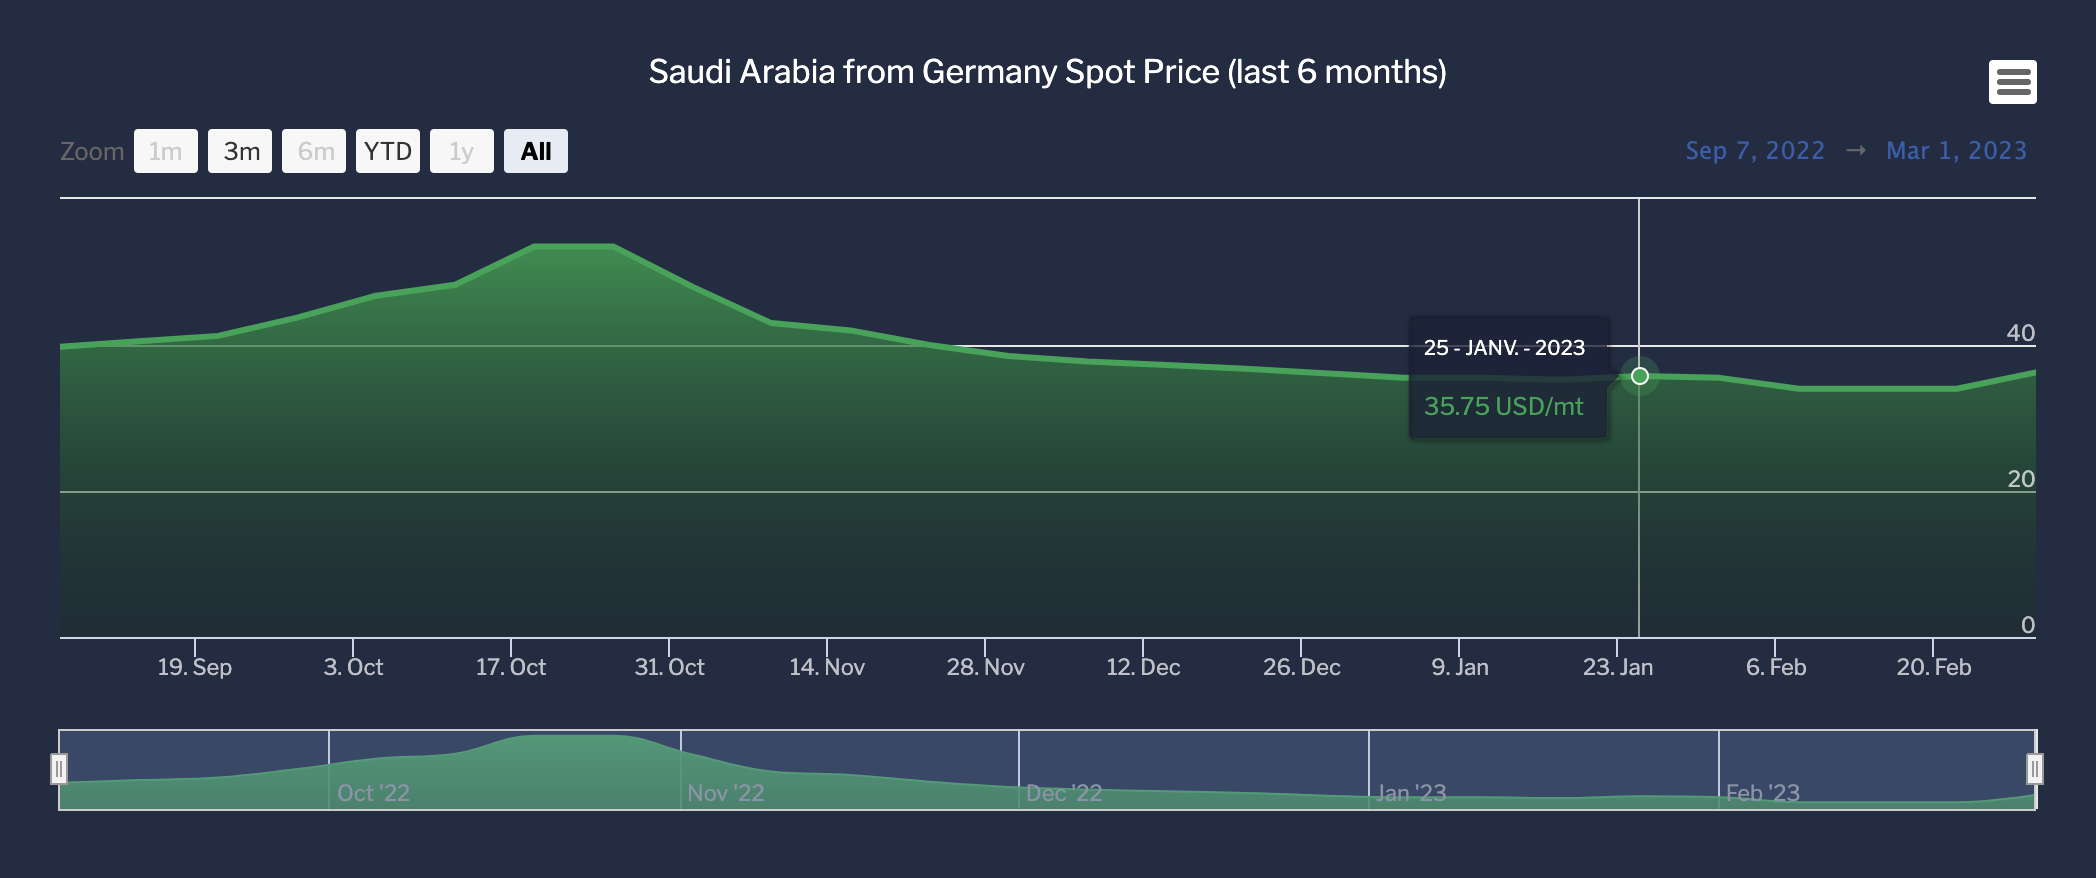
Benchmark Your Current/Past Executions
View spot freight rate indications evolution (last 6 months) and 12-month forward curve graphs. Click to download any graph.
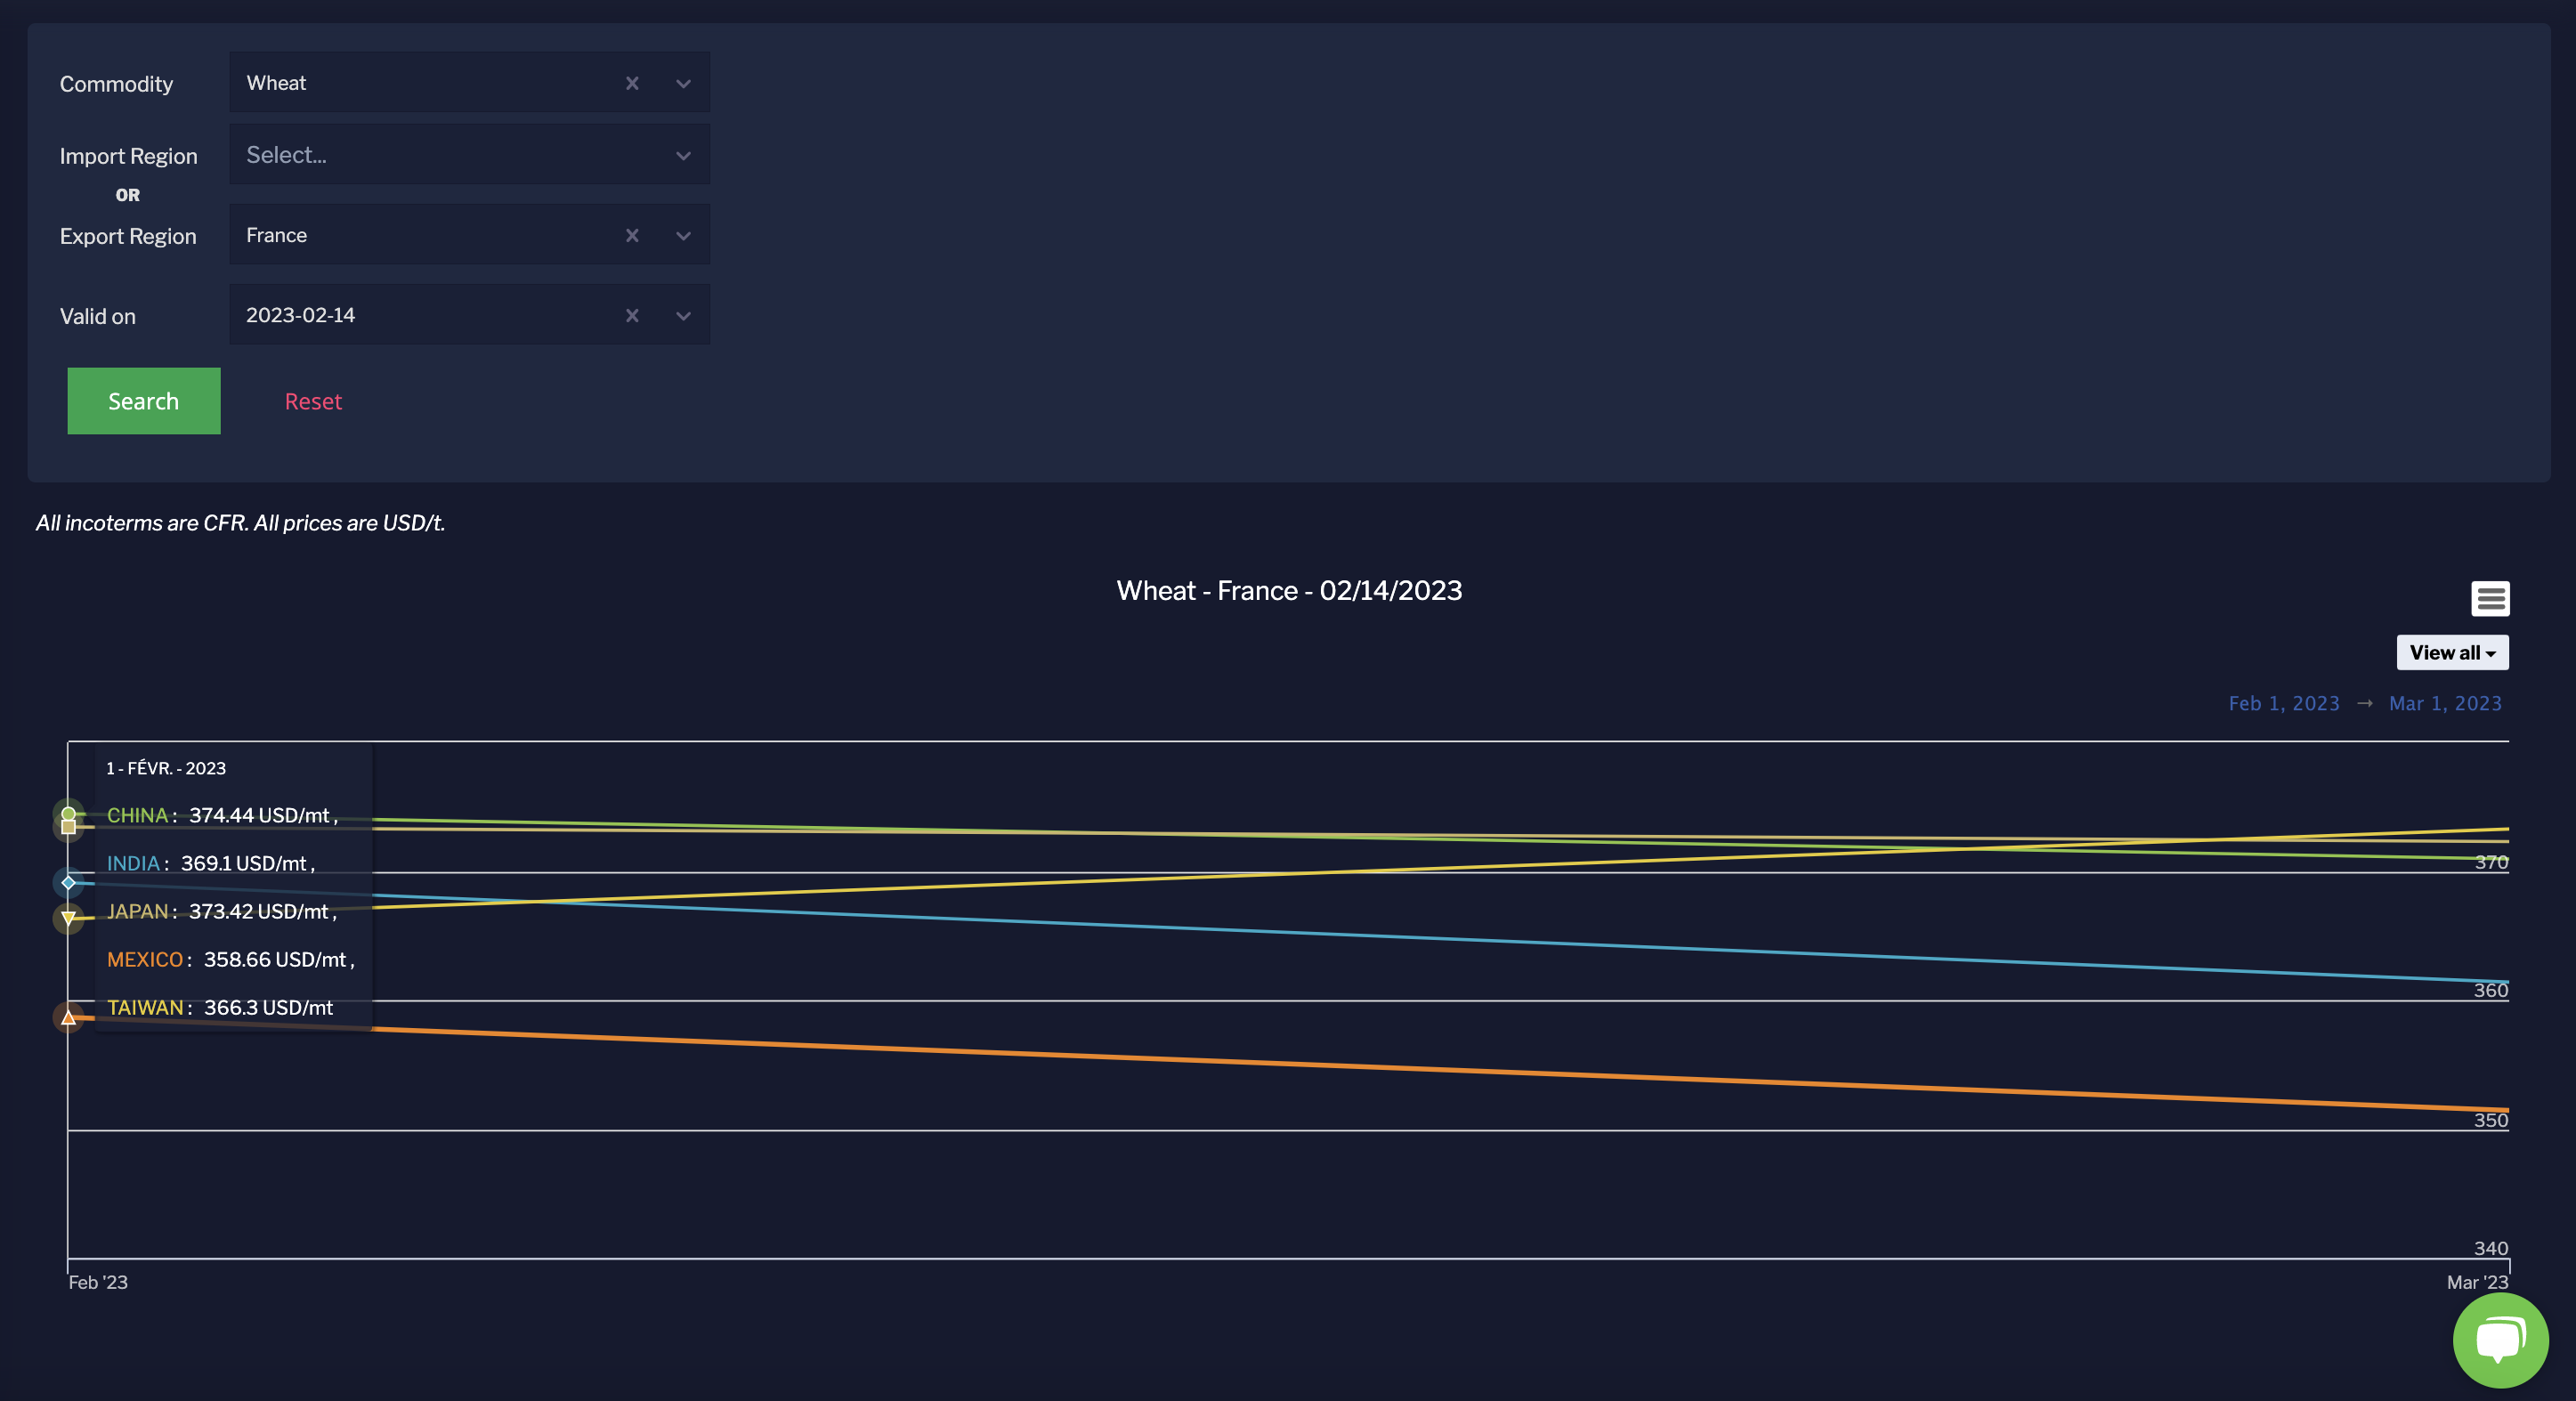
Identify the Best CFR Execution
Thanks to our CFR prices generator, we release 19,000 CFR indications daily to:
- Anticipate changes in supply & demand
- Generate new execution ideas on 269 routes
- Fill the gaps where CFR quotes are missing
The AgFlow Method to Collect Dry Bulk Rates Data
Every day, we receive 2,500 new dry bulk rates from our network of 7 freight agents, aggregate them through proprietary state-of-the-art technology, and redistribute it across the entire agricultural commodities value chain.
What Our Clients Have to Say
"I strongly recommend AgFlow to other traders or brokers dealing locally and willing to expand beyond their region, as such market data and information are not easy to get for smaller players."


