Price Discovery
With AgFlow’s Price Discovery, always know the latest physical and freight prices thanks to our updates – up to several times a day – and access forward curves, tenders, reports, and much more.

Price Discovery Package
Select a feature below to see more details:
Price Discovery
With AgFlow’s Price Discovery, always know the latest physical and freight prices thanks to our updates – up to several times a day – and access forward curves, tenders, reports, and much more.
Market Signals
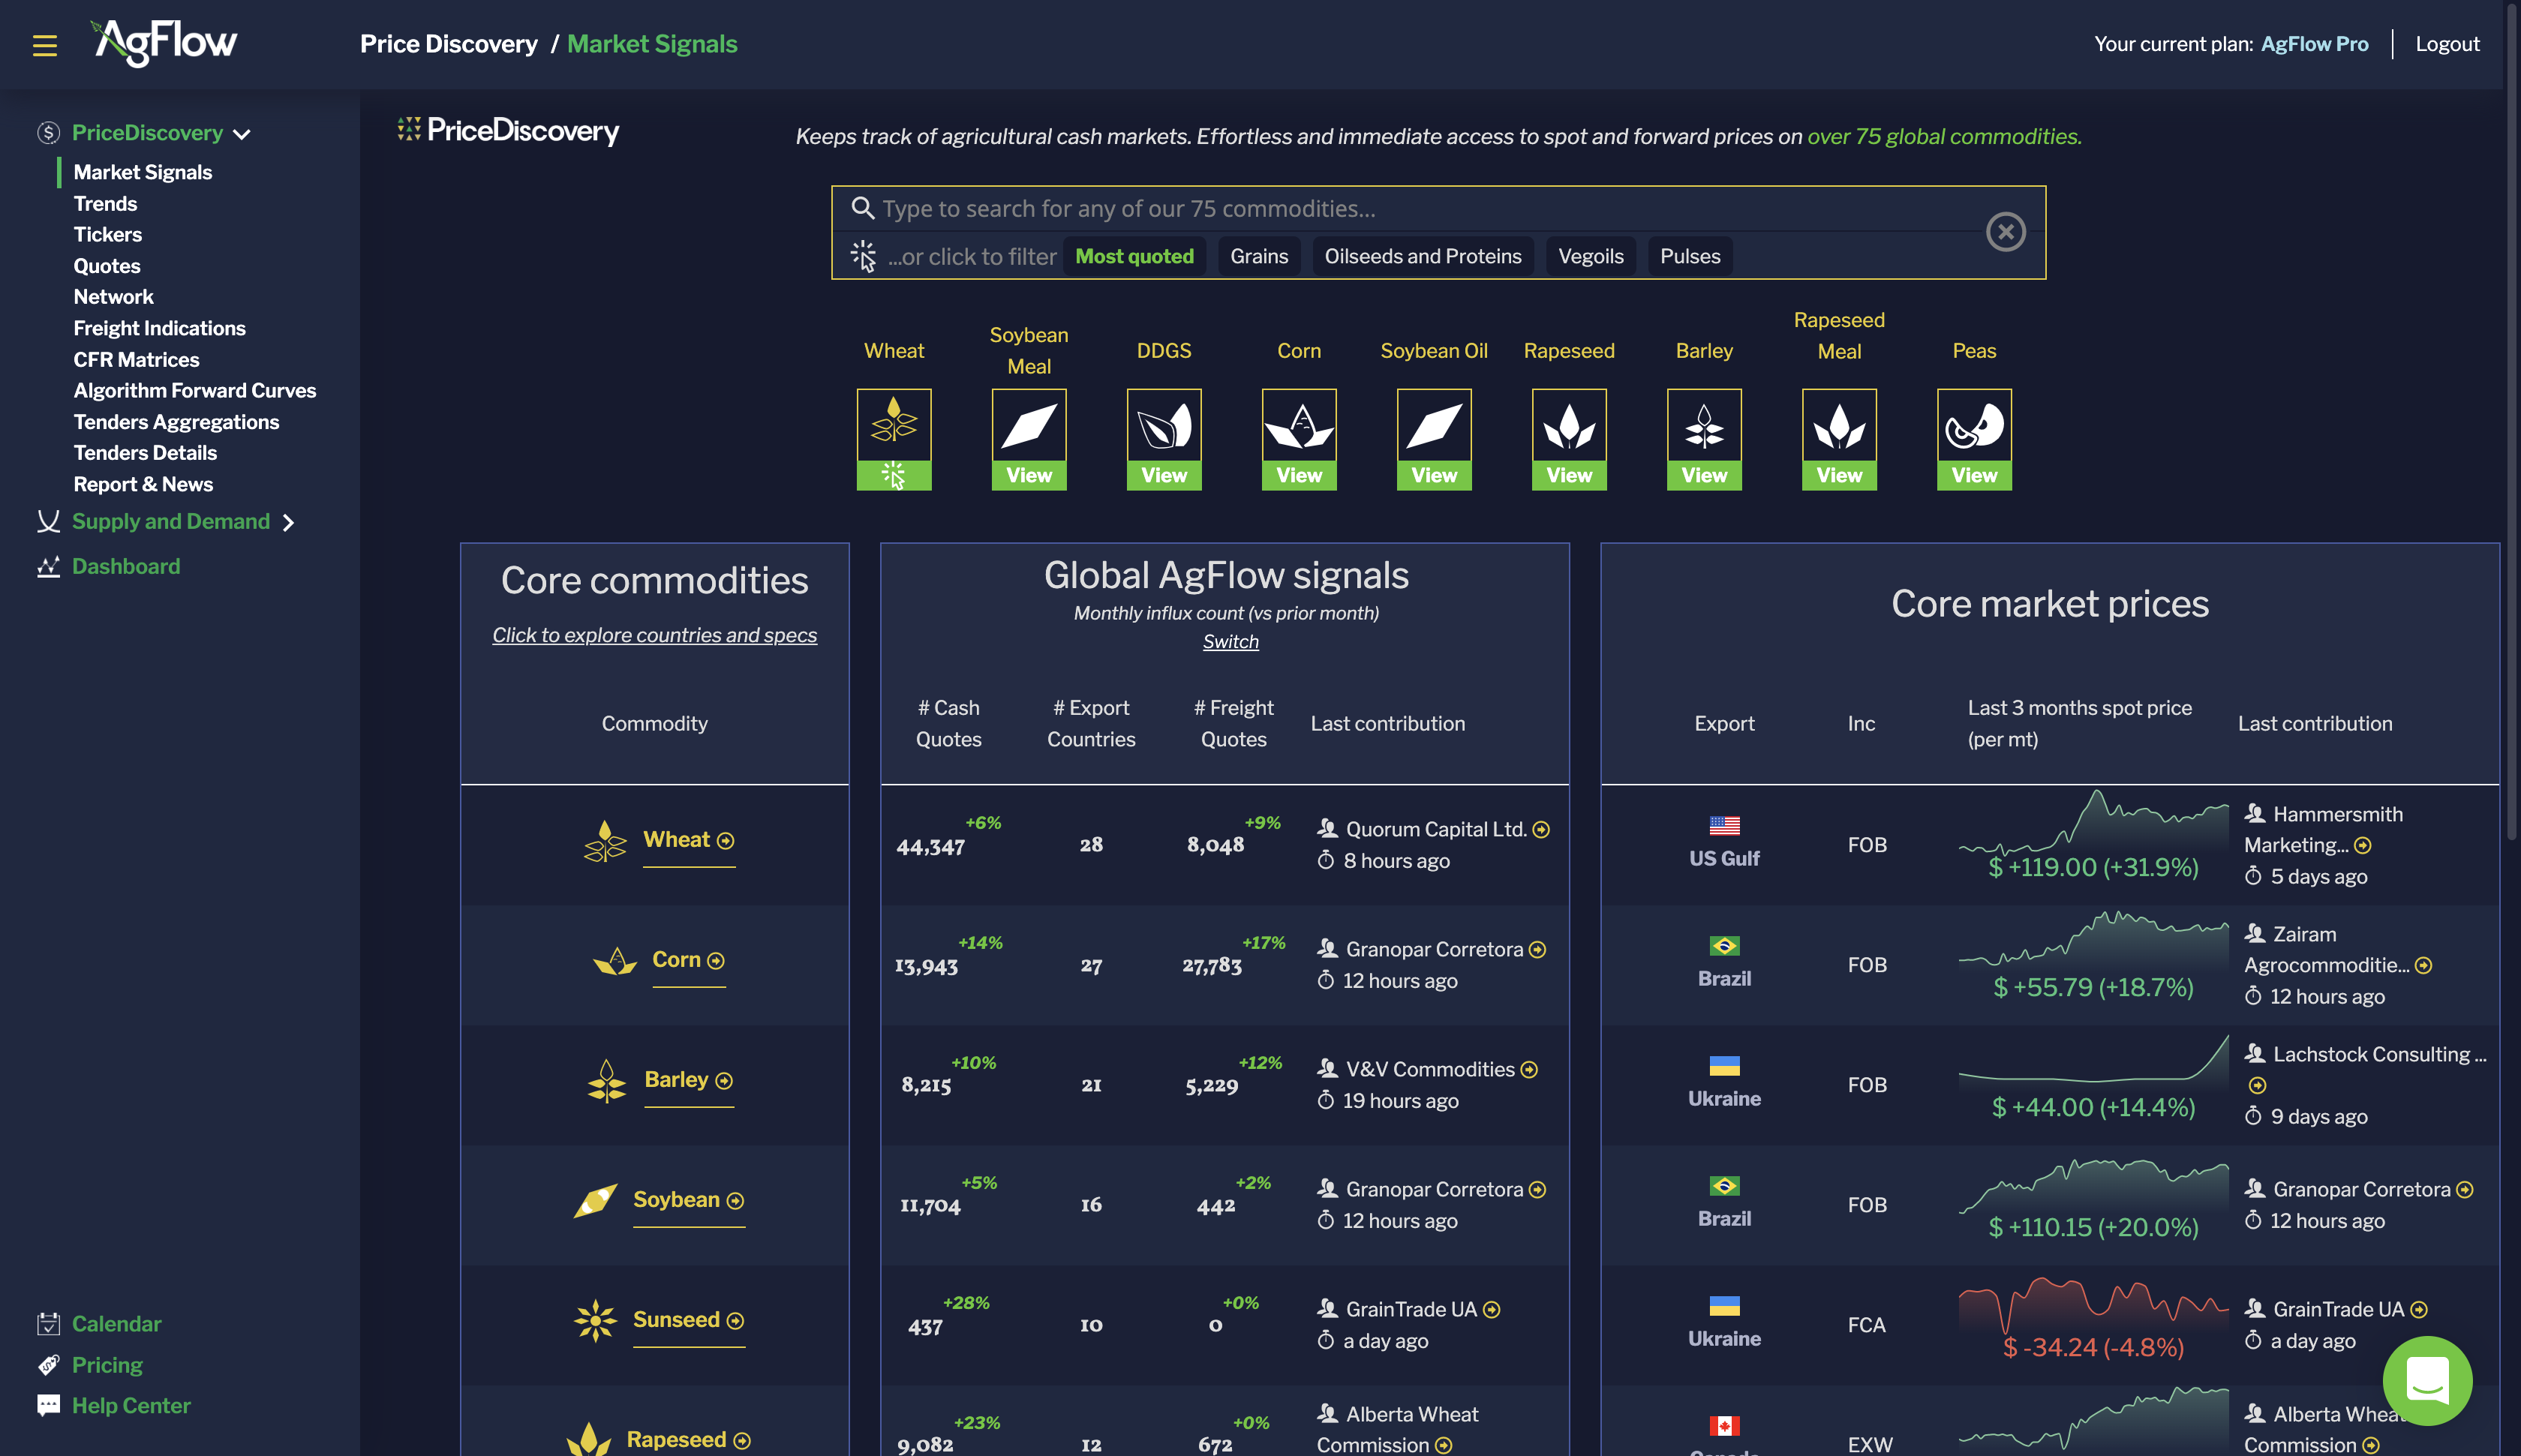
Know when and where to seize opportunities with exclusive signals on cash & freight trade volumes over the last week or month.


Measure Ag Markets Trade Volume
- Monitor market players’ activity and derive market signals
- Quickly analyze the last 3 months’ spot prices for core commodities
- View the number of new cash and freight quotes per month or per week to understand how the market is moving
Market Signals
Know when and where to seize opportunities with exclusive signals on cash & freight trade volumes over the last week or month.
Measure Ag Markets Trade Volume
- Monitor market players’ activity and derive market signals
- Quickly analyze the last 3 months’ spot prices for core commodities
- View the number of new cash and freight quotes per month or per week to understand how the market is moving

Trends
View the historical spot price trend of any export market over the last 12 months in comparison with forward curves to assess the market structure.


Monitor Cash Markets Volatility
- 7.7m historical data point consisting of bids, asks, and transactions
- More than 630 trends are available
- 12-month historical spot curves, forward curves
- Monitor core commodities contract prices, and access global trends with historical and forward curves graphs
Trends
View the historical spot price trend of any export market over the last 12 months in comparison with forward curves to assess the market structure.
Monitor Cash Markets Volatility
- 7.7m historical data point consisting of bids, asks, and transactions
- More than 630 trends are available
- 12-month historical spot curves, forward curves
- Monitor core commodities contract prices, and access global trends with historical and forward curves graphs

Tickers
Follow the average spot and forward rates of any Grain, Oilseed, or Vegoil product. Tickers are Ag products aggregated by export markets, Incoterms, and specifications.


Build Pre- & Post-trade Analysis
- View export and import country for export-based contracts, incoterms, specs, and valid on
- More than 1.2k tickers available
- Access reported prices
Tickers
Follow the average spot and forward rates of any Grain, Oilseed, or Vegoil product. Tickers are Ag products aggregated by export markets, Incoterms, and specifications.
Build Pre- & Post-trade Analysis
- View export and import country for export-based contracts, incoterms, specs, and valid on
- More than 1.2k tickers available
- Access reported prices

Physical Quotes
Leverage the world’s largest and most granular physical cash quotes database, built with a transparent network of 115+ contributors who exclusively report market events to:


Market Research
Build and analyze trading models using current and historical physical prices to support trading activities or anticipate derivatives’ price evolutions.
Risk Management
Stress-test price movements scenarios. Use physical prices as a benchmark for Mark-to-Market calculation and daily VaR reconciliation.
Sourcing
Prepare annual sourcing plans while keeping track of raw material prices variations and find the right supplier.
Trading
Track price evolutions on physical markets to find the best cash execution and the right broker.


Trade Physical Markets
- 7.7m historical data point consisting of bids, asks, and transactions
- 4k to 8k new quotes on a daily basis
- 12-month historical spot curves, forward curves
- Transparency: View the latest contribution and the source details
- Granularity: View reported price, delivery window, and related future contract
- By API or csv. downloads
Physical Quotes
Leverage the world’s largest and most granular physical cash quotes database, built with a transparent network of 115+ contributors.
Trade Physical Markets
- 7.7m historical data point consisting of bids, asks, and transactions
- 4k to 8k new quotes on a daily basis
- 12-month historical spot curves, forward curves
- Transparency: View the latest contribution and the source details
- Granularity: View reported price, delivery window, and related future contract
- By API or csv. downloads

Freight Indications
View freight markets from a global perspective across 800 ports and with 8,000 weekly updates to:


Market Research
Complete trading scenarios forecasts with current and historical freight rate indications.
Risk Management
View how freight impacts the P&L. Use as a benchmark for Mark-to-Market calculation and daily VaR reconciliation.
Sourcing
Forecast how freight impacts your sourcing plans to ensure optimal execution of your annual supply purchase.
Trading
Find the best freight execution for the cargoes you’re planning to move.


Optimize Freight Execution
- 2m historical data point consisting of freight quotes on +850 routes
- 8k to 9k new rates on a weekly basis
- 6-month historical spot prices, 12-month forward curves
- Access granular metadata such as vessel size, cargo, and tolerance
Freight Indications
View freight markets from a global perspective across 800 ports and with 8,000 weekly updates.
Optimize Freight Execution
- 2m historical data point consisting of freight quotes on +850 routes
- 8k to 9k new rates on a weekly basis
- 6-month historical spot prices, 12-month forward curves
- Access granular metadata such as vessel size, cargo, and tolerance

CFR Matrices
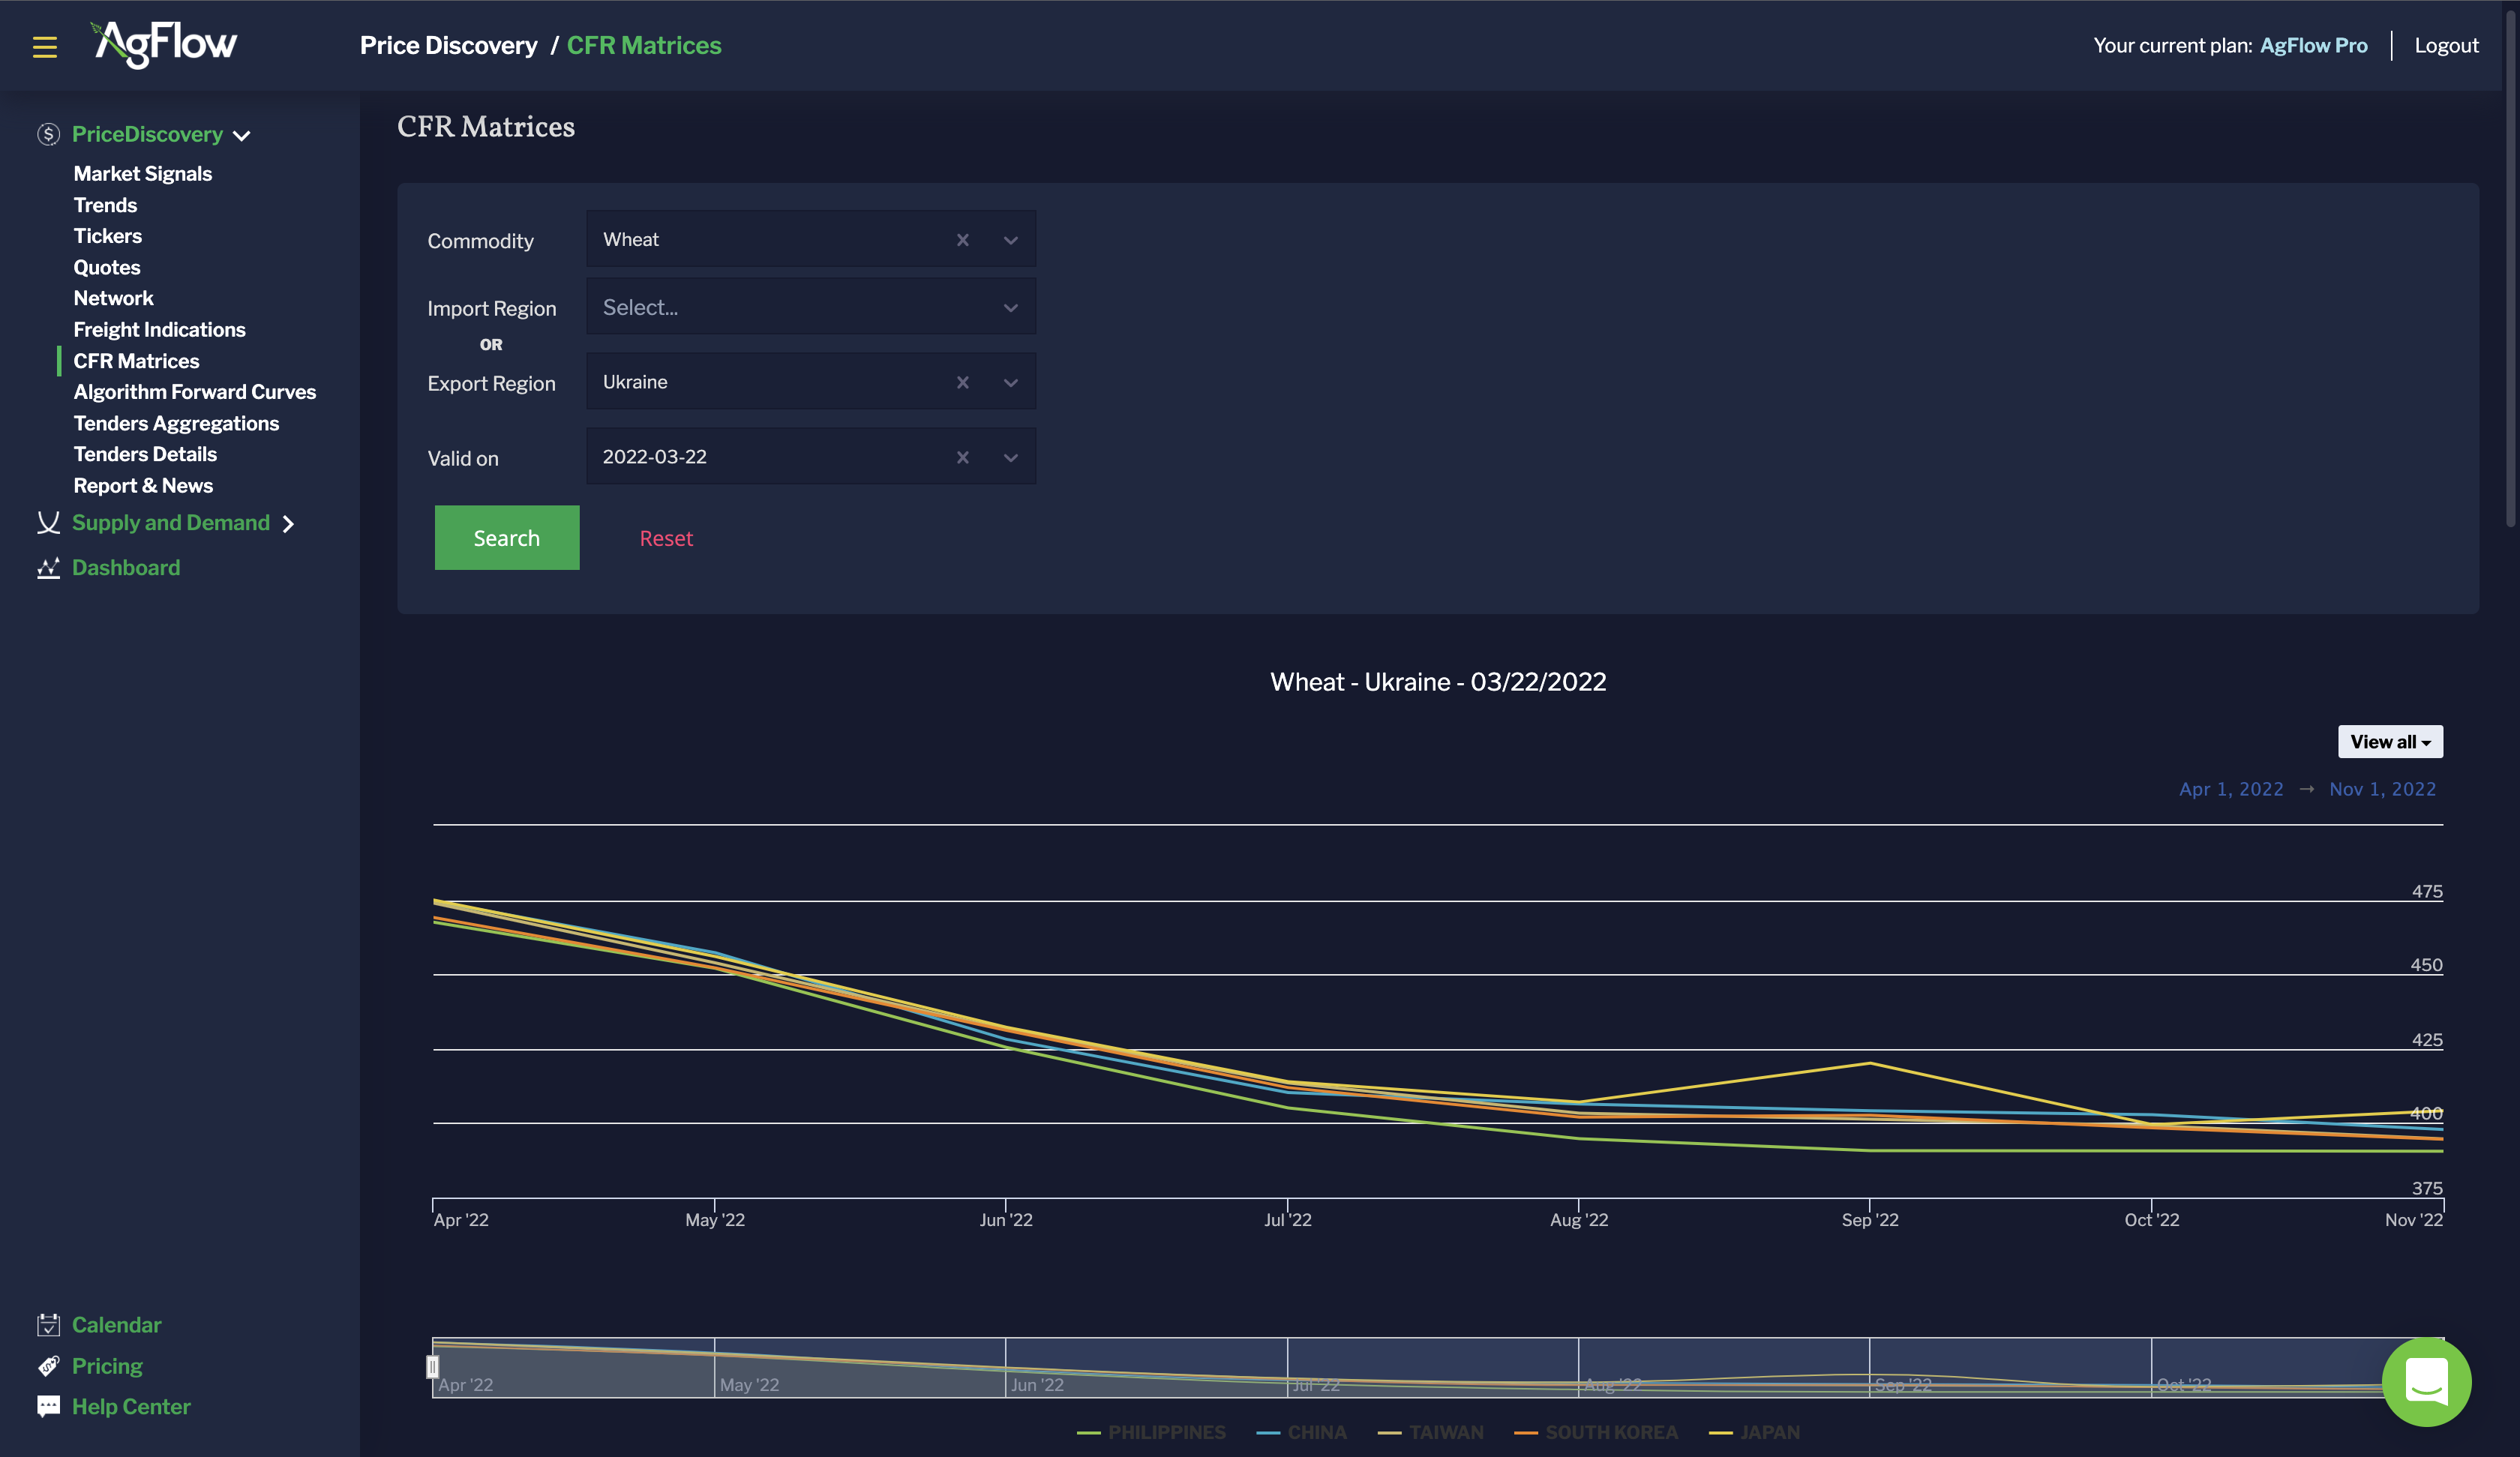
Use our CFR prices series generator, which merges raw FOB quotes and raw freight prices to:


Market Research
Anticipate changes in market supply & demand and generate new execution ideas.
Risk Management
Assess trading positions and ensure they are marked for the most efficient execution.
Sourcing
View all the sourcing pipelines available and spot where to buy in CFR in seconds.
Trading
Spot the best trading opportunities and ensure that you buy at the lowest and sell at the highest prices.


Identify the Best CFR Executions
- Always know where to buy at the lowest and sell at the highest prices
- Anticipate changes in market supply and demand
- Ensure that you mark your positions to the most efficient executions
- AgFlow CFR prices series are generated by merging raw FOB quotes and raw freight prices
CFR Matrices
Use our CFR prices series generator, which merges raw FOB quotes and raw freight prices.
Identify the Best
CFR Executions
- Always know where to buy at the lowest and sell at the highest prices
- Anticipate changes in market supply and demand
- Ensure that you mark your positions for the most efficient executions
- AgFlow CFR prices series are generated by merging raw FOB quotes and raw freight prices

Algorithmic Forward Curves
Rely on a daily market price benchmark, even when the market is opaque, with 120+ complete 12-month forward curves to:


Market Research
View if a physical price is outside its usual corridor to spot trading signals.
Risk Management
Ensure your traders’ positions are accurately marked with a complete view of the forward markets.
Trading
Rapidly identify trading signals to trade with an edge.


Fill Cash Markets' Gaps
- +120 Complete forward curves daily
- Predictions are calculated every day
- All curves are accessible before Midday CET every day
- Reconstructed and computed by our proprietary Machine Learning algorithm
- Based on 7 years of historical data
Algorithmic Forward Curves
Rely on a daily market price benchmark, even when the market is opaque, with 120+ complete 12-month forward curves.
Fill Cash Markets’ Gaps
- +120 Complete forward curves daily
- Predictions are calculated every day
- All curves are accessible before Midday CET every day
- Reconstructed and computed by our proprietary Machine Learning algorithm
- Based on 7 years of historical data

Tenders
Access the ultimate cash market reference and view the transactions details of all agricultural tenders since 2013.


Know What Was Actually Traded
- Historical Tender data series s. 2013
- From 15 countries
- View tenders volumes commodity
- Compile tender aggregates and granular results
Tenders
Access the ultimate cash market reference and view the transactions details of all agricultural tenders since 2013.
Know What Was
Actually Traded
- Historical Tender data series s. 2013
- From 15 countries
- View tenders volumes commodity
- Compile tender aggregates and granular results

Reports & News
Stay informed with exclusive market reports published several times a day by global experts and a Twitter feed of the key agricultural accounts.


Get Daily Viewpoints of Markets' Experts
- Access market analysis published daily
- Keep your finger on the market’s pulse with real-time Twitter updates from key industry players
- Access AgFlow’s public knowledge base directly from the platform, including premium content exclusive to paying customers
Reports & News
Stay informed with exclusive market reports published several times a day by global experts and a Twitter feed of the key agricultural accounts.
Get Daily Viewpoints
of Markets’ Experts
- Access market analysis published daily
- Keep your finger on the market’s pulse with real-time Twitter updates from key industry players
- Access AgFlow’s public knowledge base directly from the platform, including premium content exclusive to paying customers

Network
Unleash our network’s potential to find new information sources, suppliers & business partners.


Access the Database of +115 Contributors
- Brokers
- Consultants
- Port Agents
- Port Authorities
- Trade Associations
- Government Agencies
- Surveyors
- Shipping Firms
- Inspection Companies
Network
Unleash our network’s potential to find new information sources, suppliers & business partners.
Access the Database
of +115 Contributors
- Brokers
- Consultants
- Port Agents
- Port Authorities
- Trade Associations
- Government Agencies
- Surveyors
- Shipping Firms
- Inspection Companies

Why AgFlow?
Transparent
Prices provided without revealing the source of information are not actionable and are therefore irrelevant.
This is why we provide you with the name and contact details of our contributors.
Evidence-Based
Price assessments created out of a judgment are as good as the human behind it and are therefore inherently inaccurate.
This is why we report market events such as bids and asks.
Actionable
Out-of-context price information, disconnected from actual local realities is not timely and is inherently misleading.
This is why we provide you with transparent and fact-based information.


Join by 1,100+ of the agricultural market players

What Our Clients Have to Say
“There is simply no alternative out there, it’s either you collect all the data from different sources or you get AgFlow. This is the most complete spot and forward cash price data provider we could find.”
“I strongly recommend AgFlow to other traders or brokers dealing locally and willing to expand beyond their region, as such market data and information are not easy to get for smaller players.”

